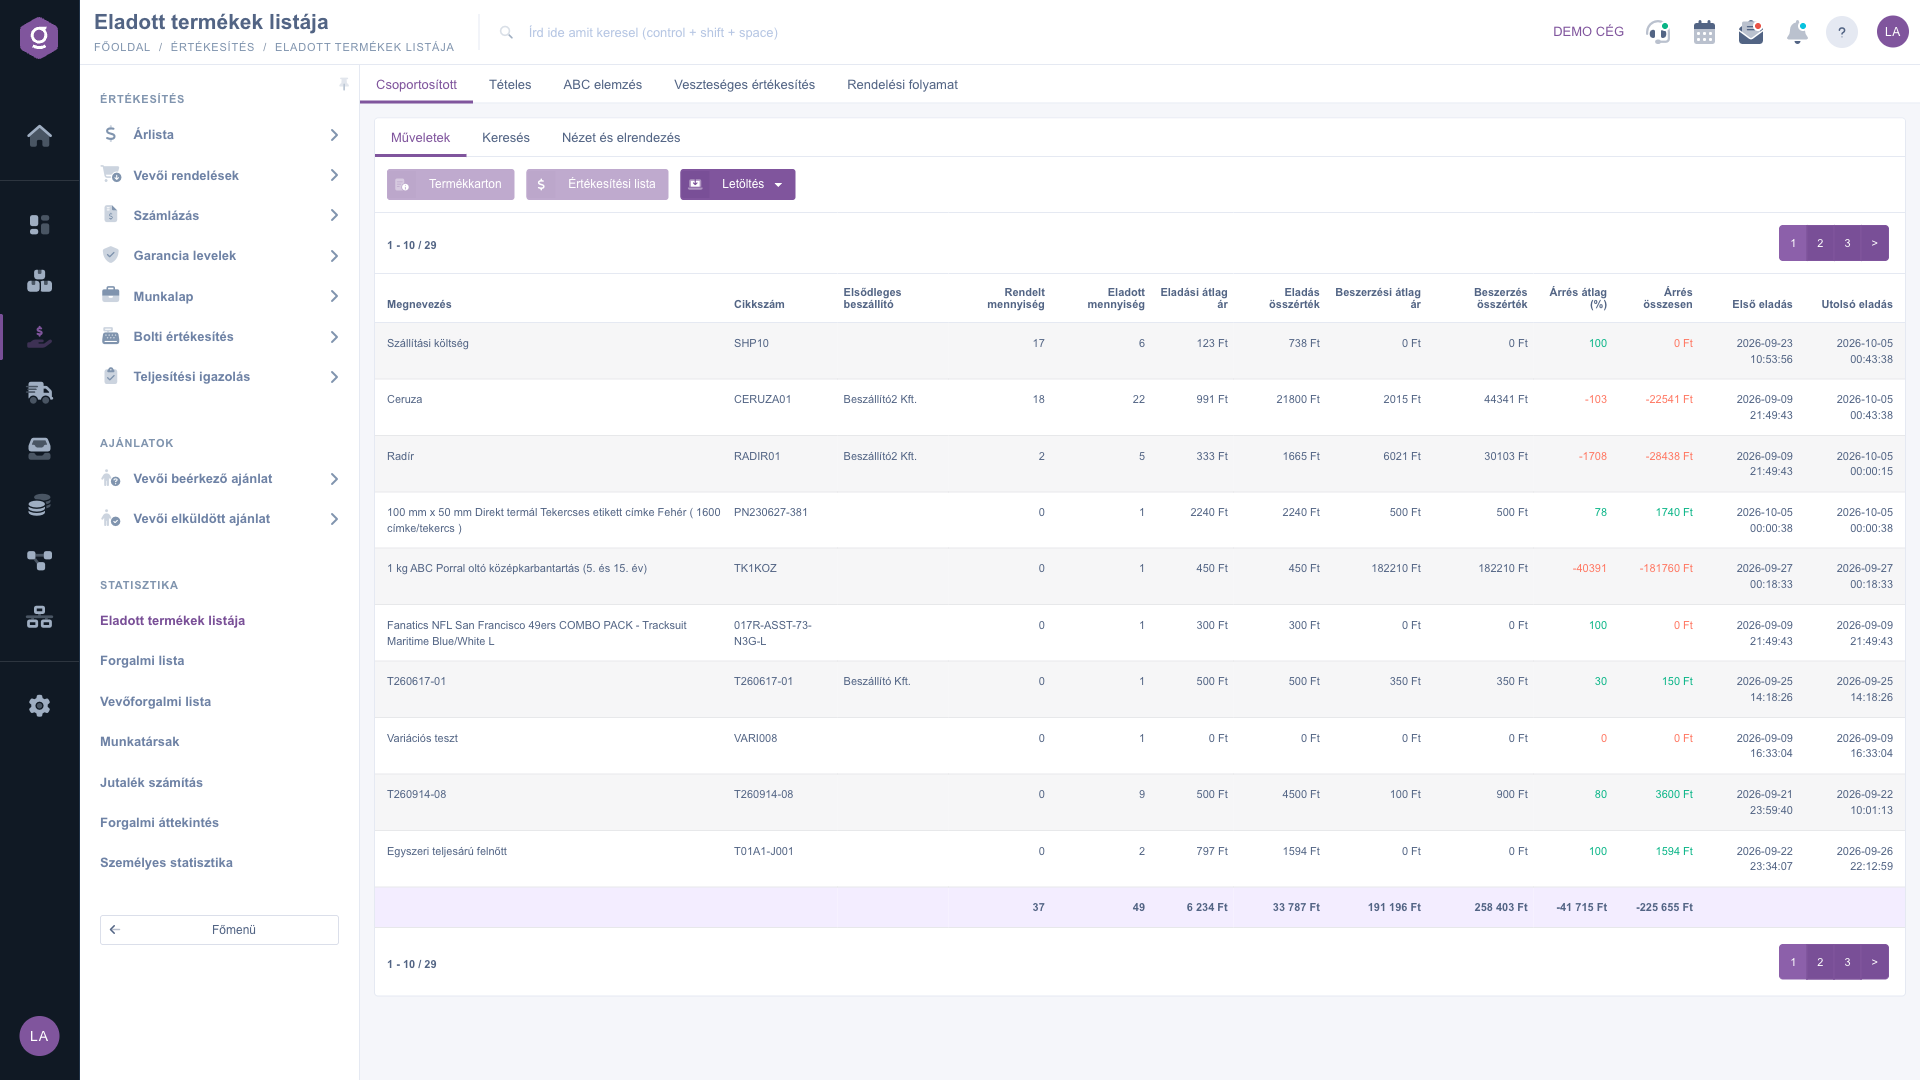
On the List of sold products page you see, summarised per product, how much of each product you sold in the selected period, at what net value, at what purchase price and with what margin. One row here means one product, not one document, so the list answers the question of what sells and what it earns. It is not meant for keeping track of documents.
The tabs at the top of the page switch to further views of the sales data: Grouped (this page), Itemized, ABC analysis, Loss-making sales and Order flow. They are not described in detail here; this article covers the Grouped view only.
Click Main menu / Sales / Statistics / List of sold products to open the list. The page opens on the Search tab, where you find the filters and, below them, the table summarised per product. The page has three tabs: Actions, Search and View and layout. The screenshots come from the Hungarian demo interface.
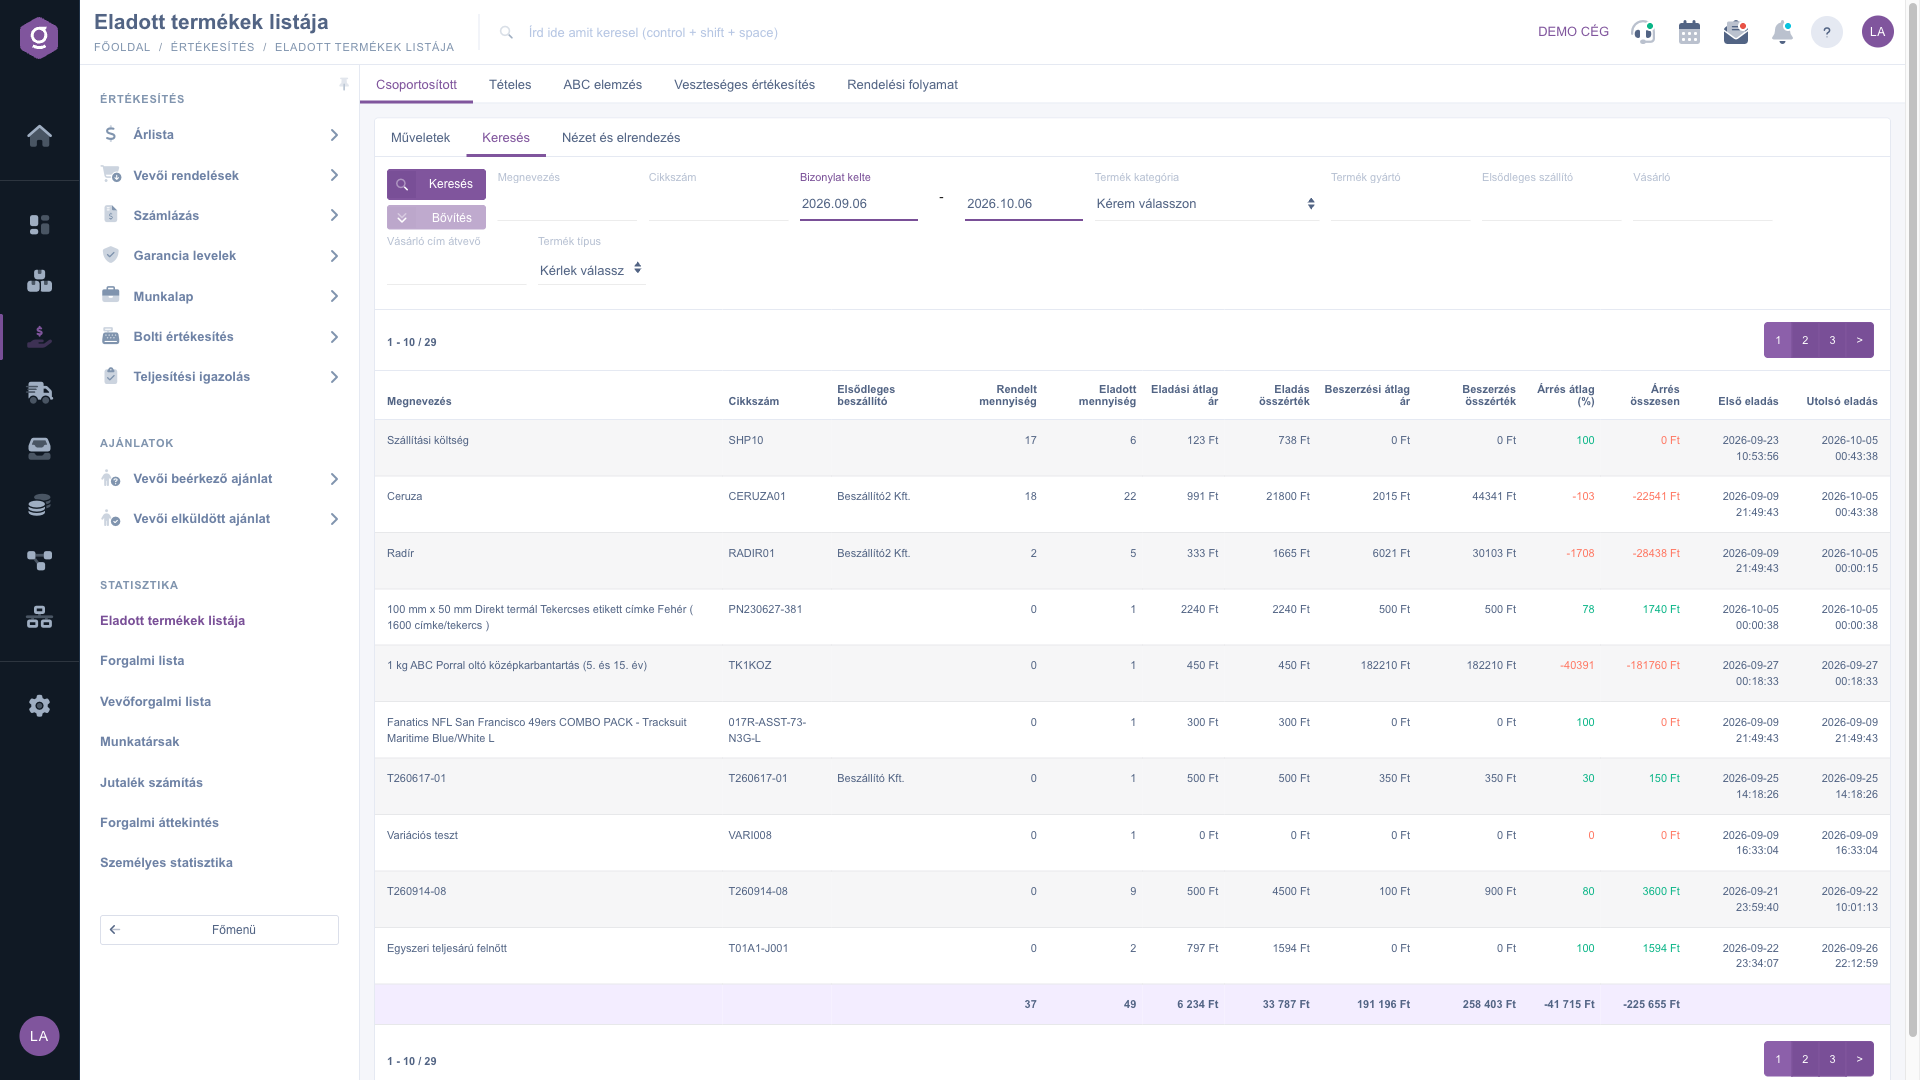
On the Search tab enter what you are interested in and click the Search button. The filters work together (AND): the more you fill in, the shorter the result list.
For the month-end closing set the Document date fields to the first and last day of the month (e.g. 2026.09.01 - 2026.09.30) and then filter by Product category. The Total sales value and Total margin columns then give you a quick monthly overview per category that you can also save as XLSX.
Hover over a column header to see a tooltip with a short explanation. The exact meaning and calculation of the columns is in the Field reference section. A few things are worth knowing in advance:
The buttons on the Actions tab work on a selected row: first click the row of the product in the table, then the button.
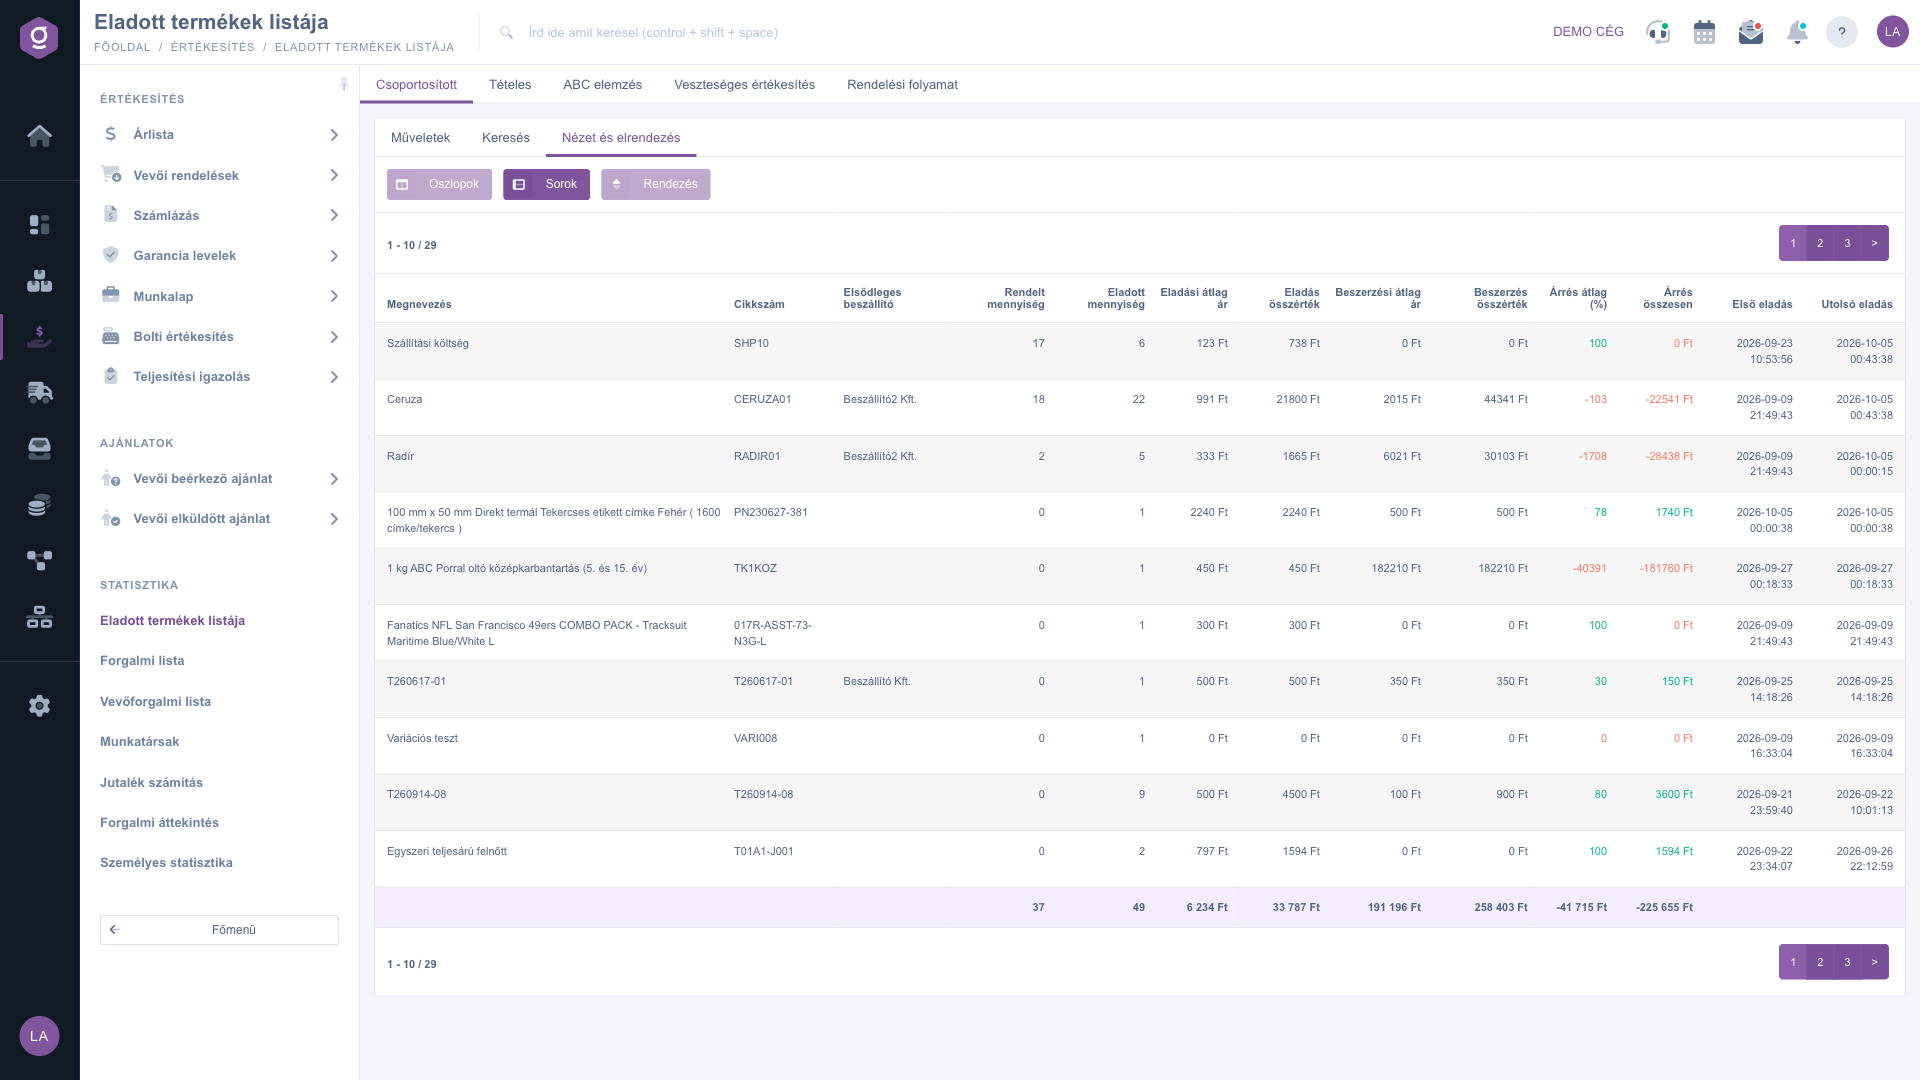
The View and layout tab shows three buttons. On this page only the Rows button (shown in Hungarian as Sorok) works: you choose how many products appear on one page (10, 25, 50 or 100) and save the choice with Save. The setting is kept for your session. The Columns button (Oszlopok) and the Sorting button are inactive on this page, so the columns and their order cannot be changed. To overview more products, raise the number of rows to 100 or download the list as XLSX.
The filters of the Search tab and their meaning (none of them is mandatory):
| Filter | Mandatory | Description |
|---|---|---|
| Name | Part of the product name; at least 3 characters are needed, shorter text is ignored. | |
| Item number | Part of the item number, or the exact barcode of the product. | |
| Document date | First and last day (both days are included). Default: the last 30 days. Both the sold and the ordered quantity refer to this period. | |
| Product category | The category set on the product master data; one can be chosen at a time. | |
| Product manufacturer | Company name of the manufacturer set on the product group; enter the full company name. | |
| Primary carrier | The primary supplier of the product (the same data as the Primary supplier column of the table); enter the full company name. | |
| Customer | Full company name of the partner the product was sold to on the document. | |
| Buyer's delivery recipient | Name of the recipient entered on the address of the customer partner (full name). | |
| Product type | The type of the product; several types can be selected at once. |
The columns of the table, their meaning and how they are calculated (one row is one product; money values are shown in the default currency, as net values):
| Column | Calculated | Meaning and calculation |
|---|---|---|
| Name | The product name from the master data. | |
| Item number | The item number of the product. | |
| Primary supplier | Company name of the primary supplier set on the product; empty if none is set. | |
| Ordered quantity | Sum of the quantities of the items of customer orders in status Closed or Fulfilled recorded for the product in the same period. Only the period and the product count; the Customer filter does not affect it. 0 for products without an order. | |
| Sold quantity | Sum of the quantities of the Closed/Fulfilled items of Invoice and In-store sale documents in the period. | |
| Average selling price | Simple average of the net unit prices of the sold items (quantity is not used as a weight). | |
| Total sales value | Sum of the net value of the sold items. | |
| Average purchase price | Simple average of the purchase unit prices recorded on the items at the time of sale. | |
| Total purchase value | Purchase unit price x quantity per item, summed up. | |
| Average margin (%) | (Total sales value - Total purchase value) / Total sales value x 100, rounded to two decimals. Cannot be calculated if the total sales value is 0. | |
| Total margin | Sum of the unit margin stored on the items x quantity. As it is based on the margin stored on the items, it can differ from the difference between the total sales and purchase value. | |
| First sale | Date of the earliest sales item in the period. | |
| Last sale | Date of the latest sales item in the period. |
The List of sold products appears in the Statistics block of the Sales menu only if the module is assigned to your user. Ask your system administrator to check the module assignment of your user.
Check in this order: (1) the Document date period covers only the last 30 days by default, so widen it; (2) is the document of type Invoice or In-store sale, and is its status Closed or Fulfilled? The items of documents that are still open do not count; (3) is the document dated 2025.03.01 or later? Earlier items are never shown; (4) is there a filter that is too narrow, especially a company name, which must be entered in full? If nothing matches, the system shows the message for an empty result list. The result may also be on another page, in which case go to the first page.
This page calculates per item and in net value, while the document lists work per document and usually with a gross total. Further differences come from the fact that only items of Closed/Fulfilled documents are included here, that the period is filtered by the date of the item, and that items in a foreign currency are converted and shown in the default currency. Use the Product card and Sales list buttons to trace the cause of a difference.
The Ordered quantity shows only the quantity recorded on customer orders (in status Closed or Fulfilled, in the same period). If the product was invoiced directly or sold at the cash desk without an order, the ordered quantity is 0. The opposite is also true: a product that was only ordered but not yet invoiced does not appear in the list, because the rows are created by the sale.
The purchase price is the value recorded on the item at the time of sale. If the product had no purchase price (e.g. a service or a shipping cost), the purchase value is 0 and the margin is 0 or the full sales value. Red marks a zero or negative margin: the product was sold at or below its cost. Check the items with the Sales list button, or look at similar cases on the Loss-making sales tab.
The sum of the rows of the page currently displayed, not of the whole result list. The quantities and values (Ordered quantity, Sold quantity, Total sales value, Total purchase value, Total margin) can be used as sums. In the average columns (Average selling price, Average purchase price, Average margin (%)) the figure is a simple sum of averages, which has no business meaning, so do not use it. For the total of the whole period raise the number of rows, or download the list as XLSX and add it up there.
Both buttons need a selected product row: click the row in the table, then open the Actions tab and click the button. Without a selected row the button has nothing to open.
These filters look for a full match of the company name, not for a part of it. Enter the name exactly as it appears in the partner master data (upper or lower case does not matter, but a missing word or a typo returns nothing). The Name and Item number fields, in contrast, also search for a part of the text.
In this view the Columns and Sorting buttons are inactive; only the number of displayed rows can be set with the Rows button. The Grouped tab is the summary per product (this page); the Itemized tab shows the single sales items, the ABC analysis classifies products by turnover, Loss-making sales shows sales below cost and Order flow shows how orders develop. They are described on separate pages.
Don't want to spend hours searching for a solution? Choose the most efficient way: book a personalized, 45-minute online training session dedicated entirely to you. Whether it's a walkthrough of the basics or a detailed setup of a specific module, our expert colleague will guide you through the whole process, step by step.
Don't waste your time - ask for help!
Our goal is to get you using our system as quickly and efficiently as possible. Whether you're completely new to us or stuck on a specific setting, don't hesitate to ask for help!
Create your account now,
pay later!